
What Osterwalder gets wrong (and right) about innovation metrics

Strategyzer, the innovation services firm co-founded by Alexander Osterwalder, has popularized several innovation tools and methodologies (e.g., the business model canvas). So, we were intrigued to see what they had to say about innovation metrics in their most recent book The Invincible Company. What we found was a focus on some of the right problems—but also a fundamental flaw in their solutions.
Strategyzer’s Approach to Innovation Metrics—Overview
Strategyzer introduce their approach to innovation metrics by highlighting a key difference between the purpose of measurement in an innovation context versus a traditional “execution” context. Innovation metrics need to help you “[determine] whether you are reducing the risk and uncertainty of new business ideas.” This contrasts with the focus, in an execution context, on tracking if a project is on-time and on-budget.
At a high level, Strategyzer point to two main jobs of innovation metrics:
- Informing investment decisions–i.e., which new projects should be funded, and which existing projects should continue to be funded or retired.
- Guiding innovation teams’ activities to ensure they de-risk an innovation as quickly and cost-effectively as possible.
Measure at three levels
To generate this insight, Strategyzer describe an approach to measuring innovation at three levels—the hypothesis level, the business model level, and the portfolio level (see table). Below we describe the innovation metrics Strategyzer recommend collecting at each of these three levels.
Hypothesis
A hypothesis is any assumption that must be true for an innovation to be successful. This might include, for example, hypotheses about each of the components of the business model canvas.
Business model
An individual innovation project that, if successful, would result in a new product, service, experience, etc. being brought to market.
Portfolio
Any set of innovation projects that are collectively managed—could be defined by organizational structure (e.g., business unit), technology area, market segment, etc.
Hypothesis Level Metrics
Tracking progress at the hypothesis level is core to Strategyzer’s approach to measuring whether the experiments you are conducting are helping to reduce risk and uncertainty. For each hypothesis, they suggest monitoring (and recording in an experiment log and a learning log):
- Success Metric—i.e., a technical metric, specific to this hypothesis, you use to establish whether you’ve proven it.
- Cost—i.e., how much the experiment has cost.
- Time Running—i.e., how long the experiment has taken (so far)
- Confidence Level—i.e., a score between 0 and 1 measuring how confident you are that the evidence supports your conclusion.
Business Model Level Metrics
At a business model level, a composite picture of progress is provided by collating data from each of the business model’s hypotheses. For each hypothesis Cost and Confidence Level are reported and two new metrics to monitor de-risking are added:
- Risk—each hypothesis’ contribution to the overall risk of the project (measured in percentage terms).
- Risk Reduction—a measure of how much your experiment(s) have contributed towards de-risking the innovation. Mathematically, Risk Reduction is the hypothesis’ Risk multiplied by the Confidence Level from your experiment.
Next, Strategyzer calculates an innovation project’s overall Innovation Risk Level. This metric quantifies the cumulative de-risking achieved by all of the individual experiments you’ve undertaken. Strategyzer calculate this metric by adding up the individual hypotheses’ Risk Reduction and subtracting that number from 100%.
Finally, the following metrics are also reported for the overall project:
- Project Duration—i.e., the total elapsed time for the project.
- Overall Cost—i.e., the sum of all costs across the project.
- Expected Return—what you choose to measure to track “expected return” should fit with the innovation’s context e.g., profitability, growth potential, environment impact, lives saved, etc.
Source: Strategyzer (click here to download from their website)
Portfolio Level Metrics
At a Portfolio Level, Strategyzer focuses on a visualization of the innovation portfolio’s Business Model metrics. The authors intend for this visual to inform resource allocation decisions—i.e., which new projects to fund and which existing projects to continue to support or kill.
Strategyzer’s recommended visualization is a standard risk versus reward matrix. They plot each innovation project’s Expected Return on the vertical axis and Innovation Risk Level on the horizontal (displayed with an inverse scale, so the highest risk projects are at left, while the lowest risk projects are at right). The authors also recommend including the following as data labels for each project on the matrix:
- Overall Cost
- Project Duration
The authors do not mention any aggregation or synthesis of Business Model Level metrics and/or calculation of new metrics for the Portfolio Level.

Source: Strategyzer (click here to download from their website)
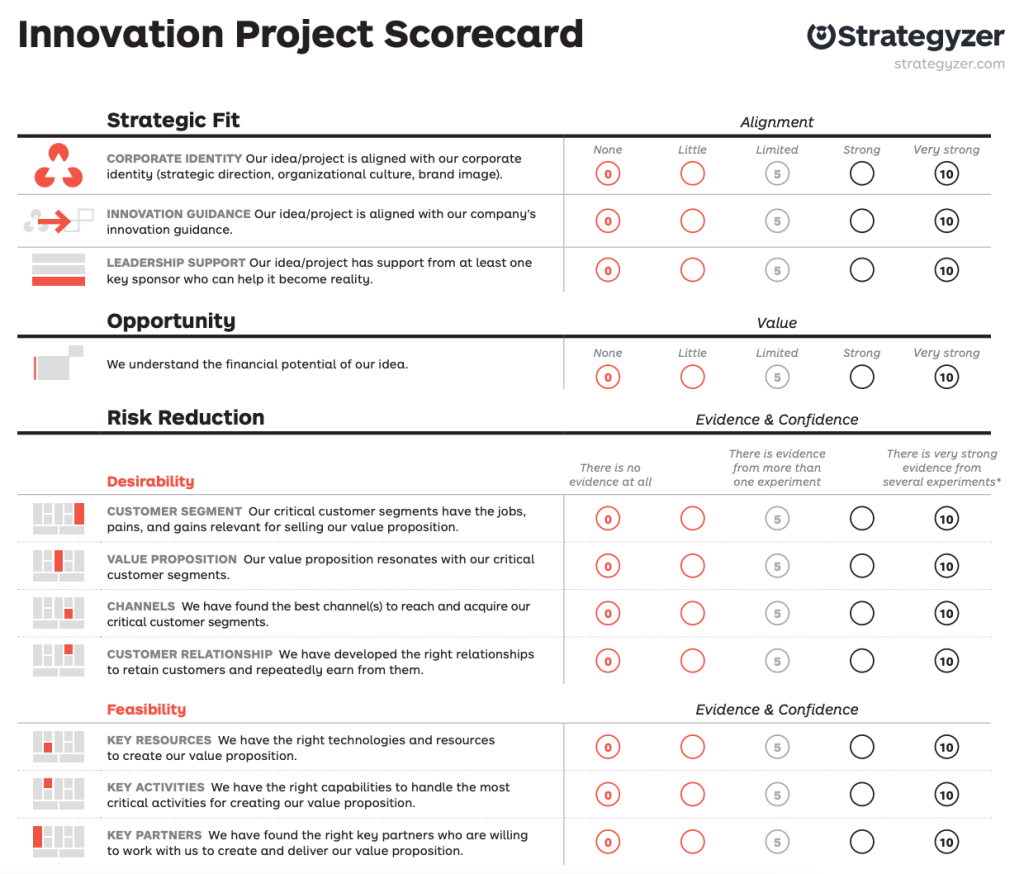
Project Scorecard
Apparently unrelated to the above collection of innovation metrics, Strategyzer also introduce their Project Scorecard, which they position as a tool to both inform project selection and evaluate project progress.
The scorecard enables assessment of an innovation’s current state against a standardized set of criteria. These criteria cover each aspect of Osterwalder’s business model canvas (e.g., value proposition, key resources, revenues, etc.). Additional criteria include consideration of the innovation’s strategic fit, the scale of the opportunity and the adaptability of the innovation to changes in the external environment (e.g., competitive forces, technology trends, macroeconomic trends). Users assign their innovation a score, from 0 (worst) to 10 (best), for each criterion, based on the strength of evidence and their confidence each criterion has been proven.
Source: Strategyzer (click here to download from their website)
Strategyzer’s Approach Has Some Key Strengths…
Based on our experience designing and researching innovation metrics and measurement systems, Strategyzer’s approach has several strengths:
1. It’s anchored in “functions”—that is, each metric collected has a specific job or function, to inform a specific decision (e.g., which innovation projects should we fund?). This ensures the approach is clear, efficient, and cost-effective. We’ll come back to whether Strategyzer’s approach covers all necessary functions.
2. It uses “levels.” By explicitly separating out innovation metrics into different levels you make it easier to communicate more clearly and efficiently. Critically, Strategyzer have recognized the need for coherence across levels — that is, they don’t suggest reporting entirely different metrics at different levels.
3. It seeks to measure learning—that is, the extent to which learning (i.e., insight from experiments) is de-risking an innovation. This marks an applaudable move away from the common focus on activity metrics and other output indicators (e.g., milestones) which are either poor proxies for learning and/or don’t enable effective communication (and therefore transparency) with stakeholders outside of the project team.
4. It seeks to enable prioritization at the hypothesis level. The Risk metric helps the team identify which hypotheses contribute the most to the overall risk of the innovation. This information can guide prioritization of time and effort across different hypotheses.
…but there is a fundamental flaw
When I first looked at Strategyzer’s approach, I really liked the apparent ability to measuring de-risking at the hypothesis level (as opposed to relying on traditional milestone-based reporting) and to use the same information, synthesized, to communicate risk of the individual project—e.g., in the risk / reward visualization. Closer inspection reveals a fairly fundamental flaw.
Recall that, at a portfolio level, Strategyzer recommends using their Innovation Risk Level metric to map risk on their Portfolio Level visualization. However, the Innovation Risk Level, as defined by Strategyzer, does not actually enable comparison of “risk” (in the general sense of the word) across projects. Instead, Innovation Risk Level is set at 100% at the beginning of a project, then the project team estimates the level of de-risking achieved (see above). It simply measures what percentage of that initial 100% remains today (based on how much you’ve learned from your experiments). So, for example, if you were to map a group of proposed innovation projects onto the visualization, the Innovation Risk Level for all projects would be 100%. Similarly, if your portfolio included a mix of new and in-progress projects, a brand-new project with an excellent probability of success could well appear to have a much higher risk level than a much more speculative project that the team has made good progress on addressing the initial risks.
Clearly this is inaccurate (and I don’t for a moment think it was Strategyzer’s intention!) and would render the Portfolio Level visualization worthless for at least one of its intended jobs—informing resource allocation decisions.
The simplest solution to this apparent oversight would be to just use a different metric to assess innovation risk for the Portfolio Level visualization. However, that would mean you lose the direct link between an experiment which proves your hypothesis (to a certain degree of confidence) and the resulting reduction in the risk reported for the overall innovation. That lack of coherence between levels can create a gap between the information being used to inform decision making at the project team level and at a leadership level.
It’s worth highlighting a related issue at this point: Strategyzer’s approach does not define how to assess risk. Somewhat confusingly, their hypothesis level Risk metric is not actually a measure of risk at all. Instead, it’s a measure of the contribution that hypothesis makes to the total risk of the project. But on what basis are innovation teams meant to assess the risk of individual hypothesis and/or the total risk of the project? Perhaps the intent is to rely on intuition. Intuition of experienced practitioners is a valuable input in many innovation decisions. However, where consistency across projects is necessary, it’s critical to enable practitioners to consider the same set of factors using a common basis.
A couple of solutions to these two problems immediately come to mind.
Firstly, you could use a scorecard to calculate a composite risk score e.g., using Strategyzer’s Project Scorecard1. That risk score could be the (arithmetic) mean of all the individual scores. Or you could calculate a weighted average, taking into consideration what experience tells you are more or less important criteria in your business.
This approach would still be compatible with a hypothesis-based approach to planning and executing your project. You would simply need to map each hypothesis to the Scorecard criterion it should impact. As you complete experiments, you would update the scoring for the mapped criterion from the Scorecard and recalculate the overall risk score. This approach would still help with prioritization—e.g., based on where risk can be most quickly and cost-effectively reduced. And, finally, it would make it easier to achieve a degree of consistency in how different innovation team assess risk.
Secondly, you could quantitatively assess the uncertainty within your innovation projects. This would require constructing a simple quantitative model that links the intended outcome (e.g., 5-year sales) to your underlying hypotheses. The uncertainty inherent in these hypotheses could then be modeled via some basic scenario analysis (Monte Carlo analysis might be appropriate for projects requiring larger investment) to determine both the overall uncertainty and the contribution of each hypothesis (which helps with prioritization). The project’s initial uncertainty could be estimated, and then, as experiments are run and hypotheses are tested, the estimates could be updated. This approach would also help to enable consistency in risk assessment across projects.
Other concerns with Strategyzer’s approach
As we reviewed Strategyzer’s approach, several additional concerns emerged, including:
1. Potential for inconsistent application of scoring-based indicators
2. An incomplete set of innovation metrics
Potential for inconsistent application of scoring-based indicators
Strategyzer’s approach includes some “scoring-based” indicators—that is, the user selects a score (e.g., between 0 and 10). Strategyzer uses these for the Project Scorecard and for estimating Confidence Level at the hypothesis level. Scoring-based indicators are helpful for converting qualitative insight into a quantitative format. However, a weakness we often encounter is a lack of consistent application—across teams and/or over time. When only minimal qualitative guidance is provided (see examples below), the chances of varying interpretations is high. This weakness can be somewhat overcome by providing more detailed qualitative descriptions of each score that “anchor” the user—see the example below.
An incomplete set of innovation metrics
Strategyzer’s approach does not describe the full set of innovation metrics an organization would need to achieve all the necessary functions of an innovation performance measurement system. While they don’t portray it as such, it’s still important to acknowledge that their approach is only a subset of what you need.
In our guide Innovation Metrics: How to Measure Innovation Performance we identify basic needs that a complete set of innovation metrics should address. The table below illustrates which aspects of this set Strategyzer’s approach covers. Coverage at the project level (equivalent to Strategyzer’s Business Model Level) is excellent, while coverage is only partial at the portfolio level and non-existent at the organizational level.

Source: Commodore
1 — It would probably make sense to invert the scale such that 0 = least risk and 10 = highest risk.
Posted on September 2, 2021 by Phil Watson
Nordic Study: 3 Common Problems With Innovation Metrics

A recently published study1, by Ilse Svensson de Jong, highlights three problems with innovation metrics that can seriously hurt firms’ innovation efforts. The study is based on in-depth case research of innovation measurement practices at a large Nordic industrial firm. The author identifies three issues:
1. No clear definition of “innovation.”
2. Lack of innovation metrics to help align innovation activities with strategy.
3. More than one set of metrics to measure the same things.
At Commodore, we’ve seen each of these problems in organizations we’ve worked with. Individually or combined, they can significantly erode the effectiveness of an organization’s innovation practices—lowering their return on investment in innovation. Below we describe the problems in more detail and suggest how to avoid them.
1. No clear definition of what is considered innovation
There is no universally accepted definition of innovation. As a result, “innovation” tends to mean different things to different people. Some might, for example, see innovation as referring to only disruptive new products or services. While others might recognize incremental improvements in manufacturing processes as innovation.
When innovation isn’t clearly defined within a firm—as was the case at the Nordic firm in the study—innovation projects can become unfocused and fail to deliver customer or business value. Resource allocation decisions (i.e., deciding which innovation projects to fund or how to distribute investment between innovation portfolios) can become difficult to agree on internally, as decision-makers fail to align on how to evaluate these choices.
If you want to know how well your firm has defined innovation, ask the next 5 people you have a meeting with to define it. Do their definitions align reasonably with the formal definition (if one exists)? Do they align with each other?
If this exercise suggests you have work to do, think about it in two steps:
1. Developing a formal definition that’s appropriate to your strategic and organizational context.
2. Communicating that definition—clearly, consistently and repeatedly—across the organization.
The process of developing a formal definition can be relatively straightforward. It’s mostly about having the right people in the ”room” and considering linkages to strategy and your broader environment. Also, it’s often helpful to begin with a broad definition and use your discussion to decide where to narrow the focus.

While most people agree the two steps are equally important, the latter is where we typically see problems occur. When terms like “innovation” (or “quality”) are overused in the abstract, the opportunities for misalignment are many. The solution is straightforward: articulate and repeat your specific definition until it becomes second nature—part of the firm’s shared vocabulary. Early on, introduce and call attention to the definition, with examples that will resonate. Remind people of the definition, particularly in decision-making settings. Later, prevent the definition from “morphing” in use by including it in formal documents and presentations—but it won’t likely need as much repetition.
2. Lack of innovation metrics to help align innovation activities with strategy
The Nordic firm in Svensson de Jong’s case study failed to use metrics to help drive alignment with the firm’s innovation strategy. If your company shares this problem, at the most basic level, you’ll have no idea whether you are actually achieving the objectives set out in the innovation strategy. It also means you’ve failed to take advantage of a powerful tool for communicating the goals and objectives set out in your innovation strategy. For example, consider the difference between:
(a) An innovation strategy that states there’s a need to increase the share of the firm’s “Horizon 3” innovation projects, and
(b) Including a metric on an innovation dashboard for senior leadership showing the current share of “Horizon 3” projects (versus the target).
In addition, you may also experience problems similar to those described above—innovation projects that are unfocused and that don’t support your strategy (e.g., too much focus on near-term incremental efforts) and lack of internal alignment on priorities, which makes agreeing which projects to fund challenging.
Aligning innovation metrics with innovation strategy is relatively straightforward:
1. Identify which decisions need to be influenced by your innovation strategy—typically these are choices about how you allocate resources across portfolios and projects.
2. Identify any specific behaviors the innovation strategy seeks to encourage.
3. Identify what information is required to inform those decisions or help encourage the desired behaviors.
4. Choose innovation metrics that provide that information.
5. Determine how to communicate those metrics to the right people, at the right time, in a format that works for them.
For a step-by-step guide description of this approach, see our guide Enhance your innovation performance measurement system.
3. Different innovation metrics for different audiences (measuring the same thing)
At the Nordic firm in Svennson de Jong’s study, there appeared to be two systems of innovation metrics emerging. Unfortunately, we frequently see two sets of innovation metrics being used within the same organization:
• The “formal” set—often prescribed by leadership and primarily used to report information “up” within the organization.
• The “informal” set—typically used by project teams or individuals, because they find the “formal” metrics don’t provide the insight they need.
To be clear, leadership and innovation project teams do have legitimate needs for different information about innovation performance. However, when each audience wants insight on the same question (e.g., is this innovation project on track?) it’s critical the metrics used are the same—or, at least, very closely related. Otherwise, there is no single source of truth, which can lead to misalignment between leadership and innovation teams—causing confusion, eroding trust, and creating conflict.
A quick way to check whether two (or more) sets of metrics existing with your organization is to talk to a couple of innovation project teams. Ask them to share how they measure their progress within the project. Then check whether that aligns with the “official” system. If there’s a significant gap, consider bringing together the stakeholders who need this information. Work with these stakeholders to build consensus on what questions they need answered and what information that requires. Then help them collaboratively select the best innovation metrics to use. We recommend having this team select metrics based on how actionable, suitable (for the context) and feasible they are. Going through this experience together will help each of the stakeholders understand each other’s perspectives and select metrics that address a cross section of needs.
1 -Svensson de Jong, Ilse. 2021. When Wrong Is Right: Leaving Room for Error in Innovation Measurement. Journal of Risk and Financial Management 14: 332. https://doi.org/10.3390/ jrfm14070332
Posted on August 26, 2021 by Phil Watson
What a recent HBR article gets wrong (and right) about innovation metrics

A recent HBR article (here) claims that use of innovation metrics (especially financial metrics) too early will “suffocate” your most promising innovations. The author, Scott Kirsner, asserts that measuring a new product with the same metrics used for established products (e.g., return on sales) leads to implicit (or explicit) benchmarking by business leaders (e.g., the CFO)—and that results in an unfavorable perception of the innovation.
The suggestion that using the wrong metrics can stifle innovation isn’t new. Financial metrics (e.g., forecast NPV) have long been blamed for stifling innovation—particularly early-stage innovation. Christensen and colleagues1 called them “innovation killers” in a 2008 HBR article and earlier work2 highlights similar issues. And most innovation practitioners we’ve worked with can provide plenty of anecdotal evidence.
Kirsner’s primary recommendation to avoid stifling innovation with the wrong metrics is to create a transition phase between the “garage” (R&D) and the “highway” (core business). During this transition phase, Kirsner recommends beginning with activity metrics (e.g., “number of prototypes created and tested”) and then eventually moving to metrics that demonstrate the impact or value of your innovations.
We have several issues with the article:
- It seems to indicate measurement primarily informs one-way communication to those outside the innovation function (e.g., the CFO). Casting measurement as “fine-tuning a spreadsheet” belittles its role when done well: it’s the means for developing a shared basis of judgment between your team and your stakeholders. Good measurement informs and debiases key decisions amid the uncertainty and ambiguity that characterize innovation.
- It recommends using activity metrics (e.g., “number of customers interviewed”) in the “…early days of developing an idea…”. At best, activity metrics simply show you’ve been “busy.” At worst, they give the (false) impression that innovation activities aren’t adding value to the organization. They can also create perverse incentives3.
- It identifies specific metrics as the problem, when the issue is typically not the metrics themselves but how those metrics are used (as highlighted by several of the innovation professionals quoted in the article).
That said, we’re glad to see innovation measurement be featured prominently, and see points we agree with in the article. Measurement for innovation is a balancing act and improving it can be challenging. And it’s critical that firms get better at measurement, if they are to improve innovation performance. So, to that end, here’s our advice on how to ensure innovation metrics help innovation performance, rather than suffocate it.
1. Don’t use forecast outcome indicators at the front end of innovation. And don’t use activity metrics.
The front end of innovation is notoriously ambiguous—too ambiguous to enable estimates of outcomes. Definitions of what constitutes the “front end” vary. We typically describe it as the set of activities you undertake to generate hypotheses for: a target customer, a target need, and a new product / service or other innovation.
Fairly obviously, it’s fundamentally impossible to estimate an outcome metric (e.g., forecast NPV from an innovation) until you have generated these hypotheses. Until the point at which you can estimate outcomes, the shared basis of judgment for a given project or portfolio should be the learning generated. So rather than resorting to distracting activity metrics (as proposed in the HBR article), you need to measure learning—or as close a proxy to learning as you can get. If you’re using a consistent front end process (which you should be!), learning proxies can be developed for each step in this process. The table below provides an example.

2. During innovation project selection evaluate a broad set of criteria and dig into the assumptions and hypotheses underlying quantitative outcome metrics.
The most common criticism leveled at financial metrics is for the role they sometimes play in selection—decisions on which new products, services, or other innovation to fund. To understand why, consider a common approach to selecting innovation projects: estimate each proposed innovation’s risk-adjusted NPV (or rNPV to cost ratio), rank them in descending order and fund all those for which you have budget. This is precisely how to not use financial metrics, but note that the problem here is not the metrics themselves, but how they are being used.
Firstly, forecast rNPV should never be the sole basis for selecting projects. A plethora of other factors should inform decision makers judgement about whether an innovation project is attractive—strategic fit, technical feasibility, strength and uniqueness of the value proposition, etc. Some organizations have had success using innovation scorecards (see this example from the people behind the business model canvas) to help reduce the focus on financial metrics.
Secondly, even when other factors are considered, innovation project selection processes are dominated by an “advocacy” mindset—as highlighted by Gary Pisano4. Teams proposing innovations (and their supporters) are focused on building the case, so they emphasize what is known and positive over what is unknown and uncertain. In this context, the team and reviewers are working with different sets of information. When forecast outcome metrics are presented, the reviewers tend to focus on the number itself—not the analysis behind it. However, the greatest value is not in what the number is, but in the underlying analysis—which is replete with assumptions and hypotheses. Understanding the qualitative information underlying the most important of these assumptions (including the quality of the supporting evidence) can be extremely valuable for developing that shared basis of judgment.
3. Change the norms you benchmark against, not necessarily the metric.
Newly launched products or services should not be compared with well established “cash cows,” but with analogous innovations at similar points in their journey. The issue here is, again, not the metric, but how it’s used—in this case the norm or benchmark against which it’s being compared. As with many other aspects of innovation performance reporting, a small amount of education (e.g., of senior leaders) and expectation setting may be necessary. In an example from an analogous context, a global manufacturing firm was just starting to track their product vitality index (PVI). They knew their current product vitality index (PVI) would be low and were unsure how quickly they could increase. Instead of setting a specific target to benchmark against, they decided to focus their leadership on the directionality of their PVI. Once they’ve established how quickly they can move the needle, they are well positioned to establish an ambitious (but credible and achievable) target.
1—Muller, J. Z. (2018). The tyranny of metrics. Princeton University Press.
2—C.M. Christensen, S.P. Kaufman, and W.C. Shih. (2008). Innovation Killers Harvard Business Review, 86/1: pp. 98-105.
3—Kerssen-van Drongelen, I.C. and Cook, A. (1997). Design principles for the development of measurement systems for research and development processes. R&D Management, 27/4: pp. 345-357.
4—Pisano, Gary P (2019). Creative Construction: The DNA of Sustained Innovation. New York, NY, Public Affairs Books
Posted on April 26, 2021 by Phil Watson
After a strong Q3, where next for innovation investment?

Innovation spending grew strongly in Q3

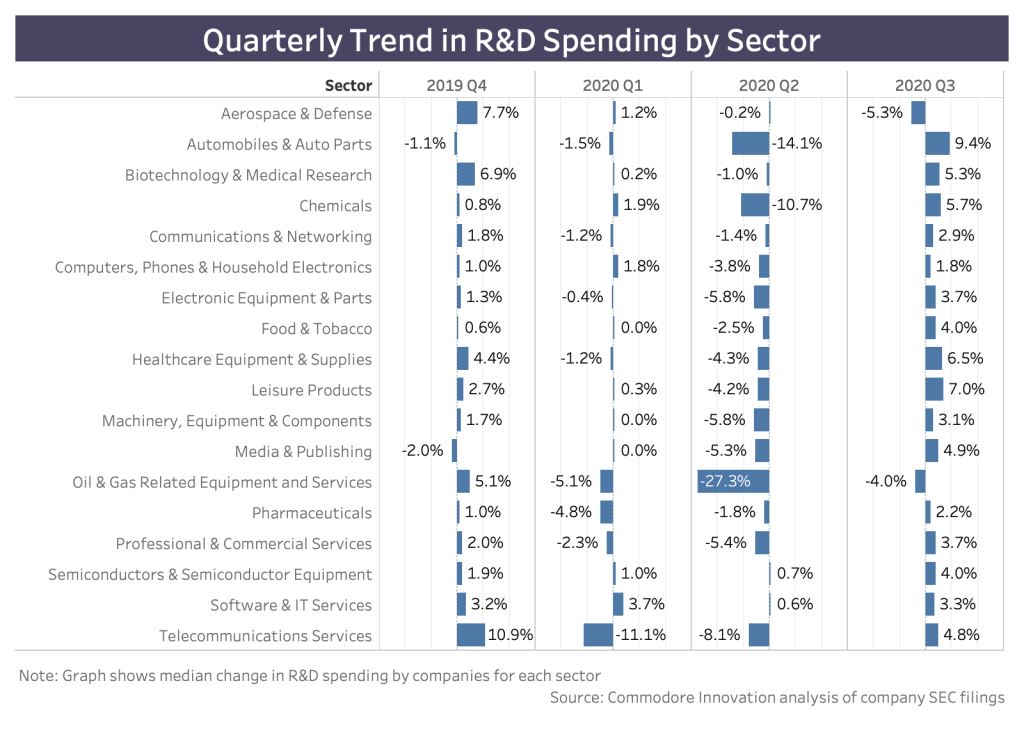
From a sector perspective, the increase in innovation investment was surprisingly broad-based. Only the Aerospace & Defense (5% decline) and Oil & Gas Equipment (4% decline) sectors showed a reduction in investment. These sectors continue to be hit hard by COVID-19 as demand in their customers’ industries (e.g. air travel, oil) show little sign of rebounding in the near future. As a result, companies in these sectors continue to reduce innovation spending as part of broader cash conservation strategies.
Several sectors saw increases in median quarterly innovation investment of over 5%
- Automobiles & Auto Parts
- Leisure Products
- Healthcare Equipment & Supplies
- Chemicals
- Biotechnology & Medical Research
In some cases, these sharp increases represent the (partial) reversal of equally sharp declines in investment earlier in 2020. In other cases, the increased investment is driven by firms who have benefited from changing consumer preferences during the pandemic (e.g. Peloton).
Where next for innovation investment?
1. Innovation is critical to surviving in the new environment created by COVID-19
Most sectors of the economy have been dramatically impacted by COVID-19, for example:
- Customers’ needs are changing—e.g., how can airports innovate to enable physical distancing, avoid congregation at pinch points such as security, and minimize human contact during screening and other processing?
- Channels are disrupted—e.g. book tours used to provide authors (especially first-time authors) with critical exposure (via events at local independent bookstores, local media, etc.). COVID has meant publishers have had to innovate to find new ways of reaching their audience.
For many companies, that means innovation is essential just to survive in their existing, core markets. This may be a different experience to prior recessions, when many firms simply had to wait for demand to rebound, largely unchanged.
Budget-constrained innovation teams may struggle to find capacity to understand and respond to the changing environment. Failure to do so will give competitors or new entrants an opportunity to get ahead. Importantly, they’ll have the opportunity to (a) learn alongside changing customer needs and (b) potentially even shape customer preferences in a way that gives them an advantage.
2. Budget cuts = loss of key people = loss of learning
Budget cuts can result in the loss of key people—either directly (layoffs) or indirectly (as people seek better environments with more secure funding. With the loss of people you lose capacity to execute innovation projects, but more importantly, you lose a wealth of experience and learning. So much of innovation is about learning, and so little of that learning is ever recorded—either at all, or in a format that is accessible and understandable to people not involved in the original work.
As a result, when you lose people, you often lose much of the learning which they undertook. Worse, you risk losing their knowledge and insight to a direct competitor if they’ve continued to invest in innovation.
3. Progress stalls
Budget cuts mean some projects are canceled or put on hold. Often innovation portfolios are adjusted to put a focus on nearer-term initiatives. That’s understandable, but it inevitably means you’re underinvesting in projects that would fuel your future growth. Obviously, those projects can be restarted in, say, a year’s time when budgets rebound—but there will inevitably be friction losses as you restart projects (e.g. as teams get back up to speed), so you’ll have lost more than a year. And, in the meantime, your competitor(s) who didn’t cut budgets will have continued to move forward.
Check Your Competitors’ Behavior
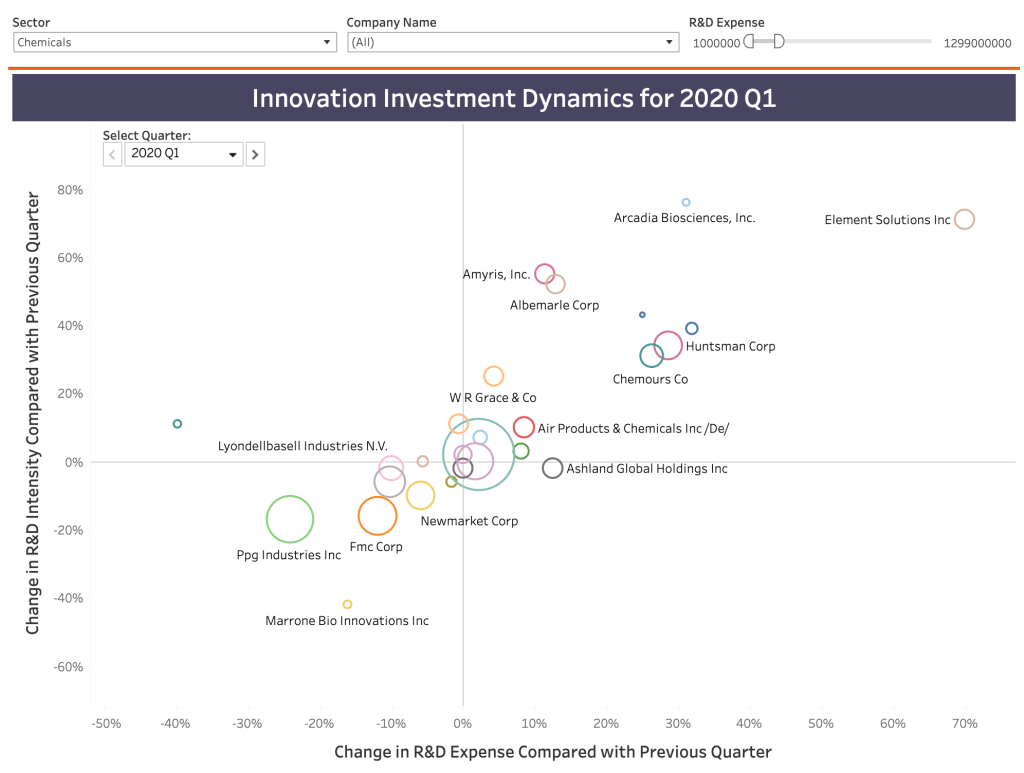
So, before making decisions about innovation budgets, firms need to evaluate how their competitors are likely to react. The (comparatively) good news is that there’s now data to inform that judgment—we can see how firms reacted to the emergence and evolution of COVID-19 this year.
Of course, circumstances will have changed (e.g. competitors’ cash positions may be less favorable; they may have benefited from changing consumer demand patterns, etc.), but understanding how those circumstances are different, alongside evidence of past behavior, provides you with a more rigorous understanding of the range of their likely behavior. And it’s certainly better than flying blind.
To help with this analysis, Commodore Innovation has assembled a dataset of firms’ quarterly innovation spending over the last 12 months. The data is based on information for US-listed firms contained in SEC filings and includes innovation spending (as measured by R&D expenditure) and R&D intensity (ratio of R&D Expense to Revenue). You can access this data visualization (a snapshot of which is provided below) to check your competitors’ behavior (for free) by registering below.
Register to access data on your competitors' innovation spending patterns for 2020
References
1 – https://www.bea.gov/sites/default/files/2020-10/gdp3q20_adv.pdf
2 – According to SEC filings up to 11/30/20, and based on firms who report quarterly R&D expense data (who account for around 80% of total annual R&D expenditure by US-listed firms).
Posted on December 11, 2020 by Phil Watson
Will AI dramatically alter the economics of innovation?

The hype surrounding artificial intelligence (AI) invites skepticism. But underlying the optimism (and fear) there’s a simple, but potentially important truth: AI, especially machine learning (deep learning in particular), could change the economics of innovation. If that happens the consequences could be far reaching [1], [2]—for competitive dynamics within industries, for economic growth, for government regulation and beyond. At a minimum, it would present companies with an extraordinary opportunity to enhance their innovation productivity—which would enhance shareholder value [3] and be an important source of competitive advantage. Companies who aren’t attempting to leverage AI to enhance innovation risk being left behind.
AI changes the economics of innovation
The innovation process is, at its most abstract, a search for better ways of addressing a need. In that search, we identify potential solutions and conduct iterative cycles of learning to predict which of those options will best address that need. AI, at a fundamental level, is a prediction tool. But it is a tool that enables predictions to be generated at an unprecedented scale, speed and cost [2]. In the hands of innovation teams, AI can enable the fast and cheap screening of millions of potential solutions to predict how well they fit the target need. Appropriately harnessed, that should enable innovation teams to enhance their productivity, by producing better innovations—more quickly and more cost effectively.
A common and straightforward example is drug discovery. In a typical simplified scenario an AI algorithm is “trained” using data about how known molecules interact with proteins (e.g. using data from existing drugs, clinical trials, etc.). A “need” is then specified by identifying a target protein that plays a role in the disease of interest. Next the trained algorithm is utilized to screen millions of potential molecules and predict which of those will be the best candidates to chemically bind with the target protein and stop it contributing to the disease. The scale and speed of this predicting and screening process is unprecedented. The potential of this type of approach has led to massive interest. Venture capitalists have poured more than $5 billion into AI startups working on drug discovery [4]. And all of the major biopharmaceutical players are partnering with or investing in early stage start-ups bringing AI platforms to market [5].
Innovators from a broad range of sectors are already using AI
Attempts to enhance innovation productivity with AI have proliferated across a diverse array of sectors, for example:
- Symrise, a flavor and fragrance manufacturer, has developed (with the help of IBM Research) Philyra, an AI platform [6]. Philyra was trained with a database of nearly 1.7 million perfume formulas, combined with information on sales performance (by country, gender and age group) [7]. Early evidence suggests Philyra was able to generate unique (and popular) fragrances that human perfumers were unlikely to have considered because of their existing cultural and professional biases.
- Nuritas, uses AI to accelerate the process of identifying novel bioactive peptides [8]. They recently worked with BASF to develop a novel rice protein-based bioactive ingredient PeptAlde that helps to modulate inflammation. Working with Nuritas enabled BASF to bring a product to market in under 2 years [9]—compared with a typical range of 4-6 years.
- Givaudan, a Swiss cosmetics manufacturer has developed an AI-based new product development platform [10]. The platform leverages historical expertise to suggest the ideal composition of a new cosmetic product, based on a target product specification (considering geographic region, government regulations, market trends, types of ingredients, retail prices, etc.)
- Stitch Fix, the online clothing retailer, uses AI in a range of ways, including directly in product development [11]. Their algorithms use data on customer preferences to suggest new designs—which can be vetted and tweaked by human designers, before being matched to target customers (who then provide feedback—helping the algorithms to learn).
- In 2019 ARPA-E, the Department of Energy’s Advanced Project’s Agency, announced [12] funding for 23 projects that are seeking to accelerate innovation processes using AI by [13] either enhancing hypothesis generation, increasing the efficiency of high-fidelity evaluation of hypotheses, or taking an “inverse design” approach whereby the product design is “expressed as an explicit function of the problem statement.” One example project aims to produce a tool that would design optical metamaterials 10,000 to 100,000 times faster than traditional methods [14].
- Within drug development, Berg, a biopharma company, is expanding the application of AI to include searching for the target itself. Their platform analyzes patient biology to identify potential target proteins and then searches for compounds that will address those targets. Berg has two drug candidates in clinical trials, including one (BPM31510) which Nature recently suggested might be the most exciting drug to emerge from any AI-based process [5].
No, it’s not all good news
Amidst all the hype and fascinating examples, hard data on whether firms are realizing the potential innovation productivity benefits of AI is scarce. Researchers have noted that the overall innovation productivity benefits aren’t yet “well established” — and there is a degree of skepticism about the extent to which such benefits will ultimately be realized [1]. Within the realm of drug discovery, for example, commentators are quick to point out that no new drugs discovered using AI have been brought to market [5].
There are a number of potential reasons for the lack of evidence:
- It’s still too early in the use of AI for the impact to show up in measures of productivity given issues of lag (it takes time for products to get to market and have impact) and scale (most firms are still only experimenting with AI, rather than adopting AI tools across the board).
- Firms are still learning how to use AI in a way that enhances innovation.
- There are potentially significant first-mover advantages to “getting it right” which suggests companies may want to keep their activities under wraps.
- Firms lack good measures of innovation productivity.
Help address the evidence gap
Commodore wants to address this evidence gap. We plan to conduct 5-10 case studies of organizations who are using AI to enhance their innovation processes. These case studies will explore the impact AI is having on key innovation productivity metrics (e.g. time to market, return on investment, etc.). We will also explore broader topics including how firms handle the cultural and change management challenges of adopting AI within innovation teams, how best to acquire and integrate AI capabilities, customer perception of AI in innovation, etc.
We’re in the process of identifying case study candidates. Participants will receive a comprehensive, independent analysis of their AI initiative’s impact on innovation productivity (for free). Note: all case studies we publish will be anonymized. If you’re interested, please let us know using the form below.
If you’re interested in receiving the case studies when published, please use the form below to ensure you’re sent a copy.
If you have questions, email us at phil@commodoreinnovation.co
Sign up
Complete the form below to get a copy of our research into AI’s impact on innovation productivity when it’s released—or to learn more about participating in the research.
References:
[1] Agrawal, A., McHale, J., & Oettl, A. (2019). Artificial Intelligence, Scientific Discovery, and Commercial Innovation. Esri. Retrieved from https://conference.nber.org/conf_papers/f129947.pdf
[2] Agrawal, A., Gans, J., & Goldfarb, A. (2018). Prediction Machines: The simple economics of artificial intelligence. Boston: Harvard Business Review Press.
[3] Cooper, M., & Knott, A. M. (n.d.). RQ Innovative Efficiency and Firm Value. SSRN, (July 2020). Retrieved from https://dx.doi.org/10.2139/ssrn.2631655
[4] VC Funding for AI in Drug Development & Clinical Trials Hits $5.2B – Signify Research. (n.d.). Retrieved September 21, 2020, from https://www.signifyresearch.net/healthcare-it/vc-funding-ai-drug-development-clinical-trials-hits-5-2b/
[5] Freedman, D. H. (2019). Hunting for New Drugs with AI The pharmaceutical industry is in a drug-discovery slump. How much can AI help? Nature, 576, S49–S53. https://doi.org/10.1038/d41586-019-03846-0
[6] Breaking new fragrance ground with Artificial Intelligence (AI): IBM Research and Symrise are working together – Symrise. (n.d.). Retrieved September 21, 2020, from https://www.symrise.com/newsroom/article/breaking-new-fragrance-ground-with-artificial-intelligence-ai-ibm-research-and-symrise-are-workin/
[7] Artificial intelligence creates perfumes without being able to smell them | Science| In-depth reporting on science and technology | DW | 31.05.2019. (n.d.). Retrieved September 21, 2020, from https://www.dw.com/en/artificial-intelligence-creates-perfumes-without-being-able-to-smell-them/a-48989202
[8] Artificial intelligence for new product development | Vitafoods Insights. (n.d.). Retrieved September 21, 2020, from https://www.vitafoodsinsights.com/product-development/artificial-intelligence-new-product-development
[9] In conversation with BASF: AI-driven peptide discovery bodes well for sports nutrition and beyond. (n.d.). Retrieved September 21, 2020, from https://www.nutraingredients.com/Article/2018/12/03/In-conversation-with-BASF-AI-driven-peptide-discovery-bodes-well-for-sports-nutrition-and-beyond
[10] Hutchinson, P. (2020). Reinventing Innovation Management: The Impact of Self-Innovating Artificial Intelligence. IEEE Transactions on Engineering Management, 1–12. https://doi.org/10.1109/tem.2020.2977222
[11] Stitch Fix: The Amazing Use Case Of Using Artificial Intelligence In Fashion Retail. (n.d.). Retrieved September 21, 2020, from https://www.forbes.com/sites/bernardmarr/2018/05/25/stitch-fix-the-amazing-use-case-of-using-artificial-intelligence-in-fashion-retail/#2a9901283292
[12] Press Release | arpa-e.energy.gov. (n.d.). Retrieved September 21, 2020, from https://arpa-e.energy.gov/news-and-media/press-releases/department-energy-announces-15-million-development-artificial
[13] ARPA-E. (2019). Funding Opportunity Announcement: DIFFERENTIATE.
[14] Lawrence Berkeley National Laboratory (LBNL) | arpa-e.energy.gov. (n.d.). Retrieved September 21, 2020, from https://arpa-e.energy.gov/technologies/projects/deep-learning-and-natural-language-processing-accelerated-inverse-design
Posted on September 22, 2020 by Phil Watson
Budget cuts are here. Time to bolster the case for innovation.

“What we are ultimately going to be able to accomplish is directly tied to the rest of the organization believing we’re important.”
—senior director of innovation, aerospace industry
Chances are you’re dealing with budget cuts for this year, and also anticipating a tough environment in 2021. In a recent survey, we found that nearly 80% of firms were cutting budgets for the remainder of 2020, while 45% expected to also cut 2021 budgets (relative to 2019). Now is the time to solidify the case for sustained investment in innovation. Formulate a message about the value of innovation to your organization and systematically disseminate that message to those whose support you need. To help you do that, we’ve compiled advice from people responsible for innovation in large organizations and a guide to building a comprehensive communication plan.
All of the innovation leaders we’ve spoken with in the last few weeks are thinking carefully about what to communicate in the face of looming budget cuts. Here’s the advice they’d offer.
Remind stakeholders innovation is part of the solution to the crisis at hand.
Consider whether any of the following bolster your case.
- Has R&D/ innovation had a recent success that may help the organization recover from the economic fallout? (One leader we spoke to was equipped with a solid story about R&D’s contribution in the last recession.)
- How is R&D/ innovation responding directly to COVID-19? (We heard a range of efforts from piloting AR/VR-enabled customer support to contributing to vaccine development.)
Highlight initiatives you know to be high-priority for your audience right now.
- Which of your projects or portfolios will they consider most important to keep on track? Which should be accelerated? (After all, some are touting two years of digital transformation in two months.)
- Are there flagship innovation events that key stakeholders value? Let them in on plans to adapt the format. (We heard about events of all shapes and sizes proceeding virtually—from big technology-focused events geared to cross-business unit collaboration to small brainstorming sessions. One leader said she usually focuses strictly on how these events are generative for the business, but now also emphasizes what they do for participants. They can bring together staff who may be feeling disconnected and energize them around the future of the business.)
Position innovation as a means to maintain the ability to think long-term.
One leader we talked to started investing time to shift his C-suite’s perspective to the long term, last year. As a result, his leadership is now positioning R&D and innovation as the thing that will bring the company out on the other side of the crisis.
A remarkable stroke of foresight on his part, but still instructive from our vantage point today. Other functions are going to have to get more tactical for now. But the business won’t survive if its ability to think in the long term is permanently hobbled. Innovation is the logical function to maintain this capability—position it as a balance while other functions necessarily focus on the short term.
Emphasize innovation’s capabilities to make sense of—and create—the “new normal.”
- What capabilities are resident in innovation (e.g., foresight, ethnography, rapid experimentation) that will be even more important given an increased need for adaptability?
- Does your team have specific tools that are helping—or could help—the rest of the organization? (We’ve heard a lot about innovation teams introducing virtual collaboration and business model design tools to the rest of their respective organizations.)
Choose the right metrics.
Use the right metrics for a focused message about the value of innovation—now is not the time for the full dashboard roadshow. Choose outcome metrics (which quantify the forecast value created by the function or a particular portfolio, or their actual results) and/or relative performance metrics (which compare the function or portfolios on key parameters such as speed and efficiency).
Now that you’ve thought about the value of innovation from a number of angles, get systematic with your communication efforts. You need to formulate a consistent message and a get that message in front of key stakeholders regularly in the coming weeks and months. Following are the basic steps to building a plan to communicate about innovation performance. For more detailed guidance, download (below) our guide “Better communication of innovation performance.” It provides a step-by-step process for establishing a communications plan for information about innovation performance.
Step 1: Characterize the people in your audience
Think through each individual (e.g., Catherine the CFO) whose support you need, rather than lumping everyone into a group (e.g., executive leadership). Consider the specific pressures each person is up against, how R&D/ innovation relates to their priorities, and potential results or projects to highlight when you’re in front of them.
Step 2: Set your objective.
Consider what, specifically, you want your audience members to do. In this context, your objective could be as simple as sustain investment in R&D/innovation at 2019 levels or limit cuts to 8 percent. If it doesn’t feel like too much of a stretch, you might consider whether you also have an intent that’s more “emotional” in nature—given the crisis, is it particularly important that you build trust or increase a sense of ownership of innovation?
Step 3: Choose your key message.
Based on the audience insight and your objective, determine your key messages. Focus on what is critical for these audience members to know, right now, to inform the decision you want them to make. You should have lots of fodder from both your measurement system and the advice above.
Step 4: Assemble the information that supports your key message.
Keep in mind that different people respond to different formats. Complement the quantitative information provided by metrics with stories that make your team’s value and relevance real. Our rule of thumb is one story to illustrate each quantitative metric. Remember your audience members’ respective pressures and priorities as you choose.
Download our guide: Better communication of innovation performance
Posted on May 15, 2020 by Phil Watson
COVID-19: Your innovation strategy’s been updated. Now what?

Many organizations’ responses to the COVID-19 crisis have already switched from the tactical to the strategic. Your organization has likely updated its innovation strategy (or at least started to). That’s an essential first step. But the changes to your innovation strategy have probably been significant—that means you’ll need to invest significant effort in implementing those changes. How you measure and communicate (internally) about innovation should be central to that effort.
How might innovation strategies change in response to COVID-19?
Innovation strategies define where you’re going with innovation (e.g., goals, focus areas) and how you’ll get there (e.g., distribution of portfolio across horizons, source of innovation). COVID-19 and the associated economic fallout demands changes to almost every aspect of innovation strategy. As business school professors drill MBAs every day: if the environment changes, so must the strategy. Today, those changes in the environment are compounded by the impact the crisis is having on innovation budgets. In a recent survey we conducted, nearly 80% of firms indicated they expected 2020 innovation spending to be lower than 2019—with 50% anticipating a decline of at least 5%, which is consistent with our analysis of historic trends in recent US recessions.
Potential changes to innovation strategy might include:
- Adjusting goals to align with the crisis’s impact on your target markets (e.g., lowering targets for revenue from new product sales).
- Reshaping innovation portfolios, e.g., placing greater emphasis on cost-saving initiatives or nearer-term revenue growth opportunities (note: we’d caution against losing sight of the reality that innovation remains responsible for the long-term future growth of the organization).
- Lowering tolerance for risk.
- Changing prioritization of opportunity areas, with some new areas emerging (e.g., “low touch” products, services, or business models) and others needing to be put on hold.
- Changing approach to innovation, e.g., a greater emphasis on lean/agile and the experimentation-based approach those imply, which will enable faster learning about a dramatically changing landscape.
Communicate changes to innovation strategy early AND often.
We wouldn’t be the first to suggest your innovation function is only as good as your people. By extension, your innovation function is only as good as your people’s understanding of your strategy, goals, and expectations. So, if your strategy changes, it is of paramount importance those changes are communicated effectively. Initially, most organizations recognize this and their changes to innovation strategy are accompanied by an initial communication push. But that initial push is rarely sustained.
To truly embed understanding of your new innovation strategy, there must be ongoing, regular communication that keeps the changes front of mind for innovation teams. And it must be done in a way that’s meaningful to them—that makes it easy to translate to their day-to-day activities. An often-overlooked mechanism for achieving that clear, ongoing communication is your innovation performance measurement system. After all, what gets measured gets managed.
Update your innovation strategy, update your innovation performance measurement system.
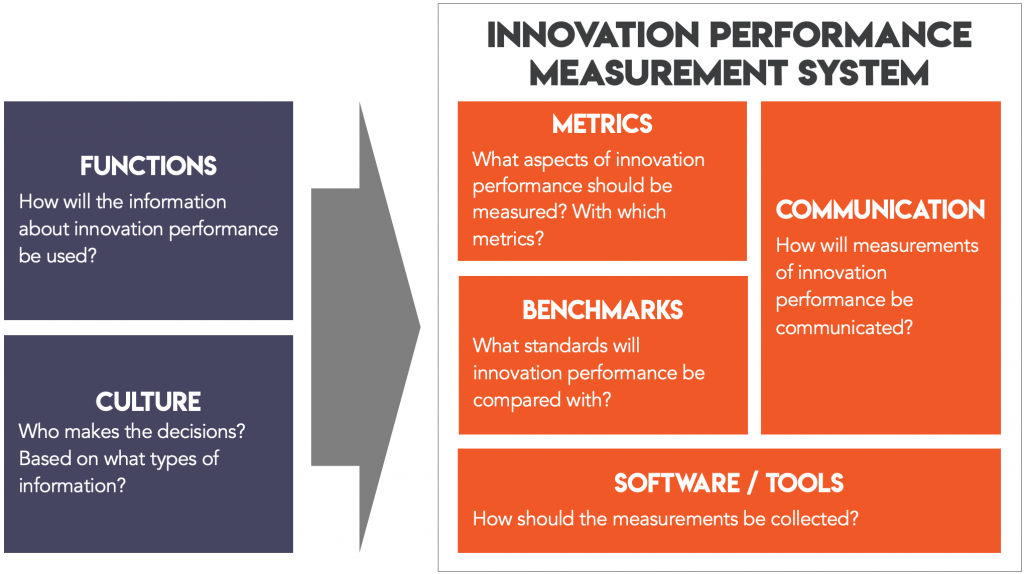
What do we mean by innovation performance measurement system? There is a tendency, when thinking about measurement of innovation, to just think about metrics—e.g., average time to market, percentage of sales from new products or services. But best practice is to treat measurement of innovation as a system (see diagram below). That system includes metrics, benchmarks (to compare performance against), and software/tools (to make metric collection and reporting more efficient). And most importantly, your measurement system includes communication of information about innovation performance—to the right people, at the right time, so that they can make good decisions.
Any time you make changes to your innovation strategy (or other major aspects of your innovation function) we recommend quickly reviewing your innovation performance measurement system to check it’s doing the job you need it to. We explain how to conduct a quick check-up below. But first, we explore the ways in which an innovation performance measurement system can reinforce changes you’ve made to your innovation strategy.
Your innovation measurement system communicates changes to innovation teams.
A well-designed innovation performance measurement system will produce a steady cadence of reminders to innovation teams. Changes in priorities will be reinforced as teams report “up” on their own projects and as they receive information about overall innovation performance. For example, an innovation dashboard might be used to succinctly communicate about overall innovation performance to the whole organization. That dashboard, shared with staff on a periodic basis (e.g., weekly, monthly) should show new goals for distribution of the portfolio (e.g., by investment horizon) and how the actual portfolio distribution has changed since those goals were introduced.
Your measurement system gets critical feedback to leadership.
During times of change in innovation strategy, it is particularly important that innovation leadership get feedback from their innovation performance measurement system.
Firstly, have the changes made to the innovation strategy produced the overall results required? For example, has the organization’s pace of innovation increased? Is there a jump in forecast near term revenue from innovations? Clearly, it is essential leadership receive this information, so they’re able to make further changes to the innovation strategy if necessary.
Secondly, leadership can determine whether detailed aspects of their changes to innovation strategy have been implemented—enabling them to take corrective action if necessary. For example, if investment in cost-saving innovations or a new opportunity area like low touch have been prioritized, an increase in investment in these areas should show up in innovation portfolio metrics.
Thirdly, if budget constraints have resulted in the loss of personnel or reduced investment in key tools or resources, innovation measurement can help monitor for unforeseen risks like “bottlenecks” in your innovation process. Just like in manufacturing, bottlenecks can occur in an innovation process. Budget cuts can lead to capacity constraints in cross-cutting functions (e.g. IP counsel) that affect the capacity of your entire innovation process.
Your measurement system can enable the innovation culture you need.
Some of the changes to innovation strategy that firms are making today are significant enough that they’ll require changes in the organization’s culture in order to be fully embedded. It’s critical your innovation measurement system enables or supports those changes in culture, rather than being a barrier to them.
There are early signals that two key characteristics of innovative cultures1 may be more important now than ever: willingness to experiment and tolerance of failure.
Where innovation teams have been able to conduct fast, low-cost experiments with low-fi prototypes they have been able to better understand how their customers, markets, and supply chains have been changing (see examples here). Critically, they’ve been able to achieve that understanding much more quickly and effectively than would be the case if they waited around for research and analysis attempting to characterize the new normal. Experimenting more in a crisis may sound risky, but experimentation doesn’t equate to lack of discipline. The metrics you use should provide guardrails for teams to select projects and design experiments based on value to the company.
In too many large organizations, tolerance for failure is sequestered in relatively small “islands” (e.g., labs, accelerators). The crisis may represent an imperative to make such tolerance more pervasive—as Gary Hamel tweeted recently: “In a small crisis, power moves to the center. In a big crisis, it moves to the periphery. When individuals realize the center is overwhelmed, they dust off their ingenuity and start improvising locally.” Again, if tolerating failure during a crisis feels counterintuitive, how you measure can provide a counterbalance. High-quality innovation performance measurement systems can differentiate between failure of an innovation project because the idea was fully tested and found to be an unattractive option (acceptable) and failure due to incompetence (unacceptable).
How to perform a quick check-up of your innovation performance measurement system.
If your innovation strategy has recently been updated (or is in the process of being updated), it’s time to quickly review your innovation performance measurement system—with a specific focus on communication.
Effective communication about innovation performance requires an explicit plan to get the right information to the people who need it, when they need it, in a format that’s accessible to them. Our guide “Better communication of innovation performance” (download below) provides a detailed process for establishing a communications plan for information about innovation performance. We recommend working through that guide with the lens of what’s changed:
- Has the “who” changed? Does COVID-19 and its economic impact mean additional audiences need information about innovation performance? Has the relative priority of different audiences changed?
- Has the “when” changed? When are critical decisions being made—for example, are they happening more frequently and so your innovation measurement system needs to be producing insight faster?
- Has the “right information” changed? Will changes in your innovation strategy (and enabling culture) be clear given how you currently measure and communicate about innovation? If not, add metrics, goals, and/or reporting that will enable that.
- Has the right “format” changed? Probably—at least while the majority of people are working remotely. If you relied heavily on in-person one-on-one or group discussions before the crisis, make sure those are still happening. But don’t assume they can be perfectly replicated in an online setting—make sure they’re adapted to the unique challenges and opportunities of online meetings.
Download our guide: Better communication of innovation performance
Posted on May 13, 2020 by Phil Watson
COVID-19: Business R&D Spending Will Fall by at Least 5-6%

In the last few weeks our worlds have been turned upside down. As individuals we are grappling with the fear, disruption and uncertainty brought about by COVID-19. The organizations we work for are scrambling to manage extraordinary challenges. In some sectors, the threat is unquestionably existential. For almost all it is likely unprecedented.
Innovation teams are not, of course, immune to this disruption. There are immediate challenges and opportunities—and longer-term challenges loom large.
This post explores historic trends in business R&D investment during recessions. If you’re interested in how companies are adjusting future spending plans for the remainder of 2020, sign up below for further information about our forthcoming benchmarking report.
Innovation should be part of the immediate response
In the immediate term, innovation teams have opportunities to stay relevant by helping their organizations respond effectively to the new environment in which we find ourselves. That might be in relatively small ways like sharing and disseminating knowledge about tools and behaviors that enhance virtual / remote collaboration. And it might be larger ways such as helping to drive or facilitate innovation processes that identify ways your organization can help our communities and our governments (e.g. a hackathon for an open source ventilator).
Longer-term implications for innovation
Innovation leaders will also need to turn their attention to longer-term questions. Recession is looking increasingly likely in many countries. In the US, current baseline or central forecasts suggest a very steep Q2 decline in GDP (-7% annualized), followed by zero growth in Q3 and a return to positive territory in Q3 (+2.6%). It is, therefore, likely that innovation teams will face budget pressure. To prepare for such challenges, historical experience can be instructive.
In five out of the last six recessions the United States has gone through since 1960, R&D spending (a good proxy for total innovation investment) by firms has declined. For example:
- Early 2000s recession: R&D spending fell by 0.9% in 2001 and a further 5.6% in 2002.
- Great Recession (late-2007 to mid-2009): R&D spending didn’t decline until 2009 (by 5.2%), but the decline continued into 2010 (0.4%).
While neither recession is entirely analogous to economists’ current forecasts, they still suggest innovation leaders should anticipate pressure to cut innovation budgets by at least 5-6% over the next 12-18 months. Obviously, this is based on an average impact across all sectors of the US economy—some firms will face pressure for much greater cuts.

Prepare for innovation budget pressure now
It is imperative that innovation leaders start preparing for budget conversations now. To do that, we recommend preparing to:
- Demonstrate the value of innovation to the organization.
- Run leaner.
- Gather benchmarking data.
Demonstrate value
Now more than ever it’s critical your key stakeholders across the organization understand the value innovation brings. Ideally you already have a comprehensive set of innovation metrics that help you demonstrate your innovation team’s return on investment. To check you’re measuring what you need to check your metrics against our measurement framework or take our self-assessment. If you’re not measuring what you need to, now is the time to quickly assemble that data.
The quantitative information provided by metrics should be complemented by stories that make your team’s value and relevance real. Given the current context, these stories could include examples of how your innovation team is supporting your organization’s immediate response to the COVID-19 crisis. And how innovation helped your organization recover from prior recessions.
Prepare to run leaner
Most innovation teams are likely to face significant cuts. That means you need to start preparing to run leaner—now. Again, innovation metrics can help. If you have a comprehensive innovation performance measurement system in place, it will provide you with the insight necessary to know how to run leaner. For example, it will tell you which projects and portfolios deliver higher RoI. And it will highlight areas of your innovation process that could be more efficient.
If you don’t have the insight necessary to inform those decisions, it’s not too late to assemble it. The alternative is to fly blind.
Gather benchmarking data
When setting budgets for innovation / R&D many firms want to understand how their investment levels compare with their competitors’. R&D as a percent of revenue is a common, if somewhat flawed, benchmark. Such insight will be an important input into forthcoming discussions about future funding levels. In some ways it’s more important than ever to understand what your competitors will be doing. If your company cuts innovation spending, but a competitor doesn’t, will you lose your technology leadership position?
Forward-looking benchmarking data on R&D spending is not readily available. Commodore is preparing a benchmarking report analyzing innovation / R&D spending plans for the remainder of 2020. If you are interested in sharing data and receiving the report, sign up below to receive further information.
Forthcoming Report: Benchmarking Innovation Investment post COVID-19
Complete the form below to receive further information about Commodore Innovation’s forthcoming (free) report benchmarking innovation spend plans for the next 12 months.
Posted on March 23, 2020 by Phil Watson
How to improve measurement of innovation performance in your organization.

Once you’ve decided you want to do something about how your organization measures innovation performance, knowing what to do next isn’t always obvious. We often have conversations with innovation leaders who get to this point and reach out to us for advice on what to do next. Our advice tends to cover some combination of the following, which we expand on further in this post:
- Understand whether there are good reasons to tackle innovation measurement now (go to section).
- Caution against treating software as the off-the-shelf solution (go to section).
- Offer advice on when we’ve seen it make sense to tackle innovation measurement in-house—and point to tools and resources they can use (go to section).
- Advise on when it makes sense to bring in outside help, and what to look for (go to section).
What are some signs that innovation performance measurement should be a priority?
Sometimes it’s inescapable: new executive or innovation leadership asks the question: “Are we measuring innovation the right way?” If that’s the case, you’ll likely have to to proceed with a review of your measurement system. If not, consider the next 3 situations.
(1) A new innovation process needs to be measured
A new innovation process almost always requires consideration of how to measure its performance. By “new” we don’t just mean: your firm didn’t have any formal innovation activities and processes before, and now it does. We’ve also helped firms who have had decades of innovation / R&D experience, but who are adding a completely new way of innovating (e.g. a stand-alone “innovation lab”) or who’ve expanded their scope to include innovation activities they weren’t previously (e.g. the focus used to be exclusively new product development, but now includes substantial “front end” activities as well).
We often get this question from our clients in these situations: given we’re just getting started, how soon does it make sense to tackle innovation measurement? Every situation is different, but there are a couple of rules of thumb:
- Consider innovation measurement after you have reasonable clarity and alignment around the purpose or strategy of your new innovation process.
- Know how you’re measuring your efforts before you’re asked by your superiors or other key internal stakeholders.
(2) It’s been at least 2-3 years anyone reviewed innovation measurement.
A simple guide to whether you should be reviewing your established measurement system is whether or not it’s been evaluated in the last 2-3 years. Innovation systems tend to evolve quickly: you try new tools and methods, bring in new people, add new measurement capabilities (e.g. from software), and integrate with acquired companies. Measurement systems, on the other hand, tend to be in the “set it and forget it” bucket: no one really has enough time available to take a systematic look and make sure the system is doing what you need it to.
As a result, we often find measurement systems that aren’t performing the functions an organization needs of it. This can lead to wasted time collecting and reporting metrics that no one uses. And, in the worst case, metrics that send misleading signals or create misaligned incentives. So for these reasons, we recommend clients take a least a quick look at their measurement system every few years.
(3) Subtle indicators you need to enhance innovation performance measurement.
More subtle signs you need to consider innovation measurement include:
- You feel like you need better information or explanations for leadership or other stakeholders—you’re not having high-quality conversations or you’re spending an inordinate amount of time “defending” innovation strategy or specific decisions.
- You or your teams don’t feel confident in the decisions you’re making—prioritizing and selecting projects, allocating funds to align with strategy, etc.
- You’re concerned about declining innovation performance in your organization.
- You’re having a hard time creating a culture that supports innovation AND has the appropriate checks and balances in place (read our post on this subject).
No, innovation management software isn’t the answer (or, at least, not the full answer).
Innovation management software doesn’t tell you what to measure. Sometimes, innovation managers make the assumption that, if they have the right innovation management software, the measurement will take care of itself. If only it were that simple. Innovation management software is a critical aspect of an innovation measurement system. But innovation management software is designed to enable measurement of as many different factors as possible. This is precisely because what needs to be measured varies so much from organization to organization—software providers have to make their systems flexible. So don’t treat software as the solution. We always help our clients establish what they need to measure first, and then turn to what software should be used, and how to use it.
On a related note, many organizations are finding that innovation software isn’t the best tool for analyzing and communicating innovation metrics. That’s because, notwithstanding the comments above, there isn’t sufficient flexibility with the software to address the very specific needs of their audiences, and the frequency with which those needs are changing. And also because of the need to integrate data from across multiple systems (e.g. product lifecycle management, broader enterprise resource planning systems). As a result, we have found that many organizations are doing much of their analysis and reporting within generic business intelligence software (e.g. Microsoft Power BI, Tableau, Qlikview).
Tackle improvements to your innovation performance measurement system in-house when you have leadership support and the right capabilities available.
Some organizations choose to undertake initiatives to improve their innovation performance measurement system in-house. We’ve seen this work well under certain conditions:
- There is strong leadership support for the initiative—e.g. from the VP or SVP for Innovation or R&D, or the Chief Technology or Innovation Officer.
- The owner of the innovation process for the organization has the capacity to closely manage the initiative.
- Staff with the right skillset and experience have bandwidth to execute the initiative. Those staff need to understand the fundamentals of measuring innovation performance and deeply understand all aspects of your innovation process. How much bandwidth depends on the scale and complexity of your innovation function. If you’re spending 10M+ annually it will need to be one person’s primary responsibility for several months.
If you’re looking for an example of an organization that successfully completed improvements in-house, check out this webinar from Parker-Hannifin Corporation (Frost & Sullivan presented the webinar, but Parker did the work in-house).
If you choose to proceed with improvement innovation performance measurement in-house, there are a few resources that could be helpful:
- If you like to hit the books, check out our Library—we list academic and other articles and books we think are helpful.
- If you’re interested in training on the fundamentals of improving innovation performance measurement, send us an email—we have some courses in the works.
- Check out online “how to” guides. Commodore has several here—you might start with our Guide to Measuring the Performance of an Innovation Portfolio.
Use outside help when you need to move quickly, an independent perspective, or deep measurement expertise.
We find that organizations benefit the most from specialist expertise in innovation measurement when one or more of the following conditions exist:
- They need to move quickly, and don’t have the internal capacity to move forward.
- There’s a need for an independent perspective—measurement of innovation performance can quickly get political (you’re talking about how people’s success is evaluated!), so sometimes it’s helpful to have an independent, dispassionate third party lead the conversation internally.
- There’s no one available internally with deep expertise in innovation measurement—this is pretty common, as most of your best people are already busy managing innovation projects or portfolios and the short-term opportunity cost of pulling them off those activities can be high.
If you recognize yourself in any of those conditions, get in touch—we’d be happy to see if there’s a way we can help.
Posted on July 25, 2019 by Phil Watson
The Innovation Culture Balancing Act

Everyone agrees that organizational culture is a key driver of (or hindrance to!) innovation performance. It’s obvious on its face, given that culture affects things like how well teams work together, how fast decisions are made, and how much risk is tolerated. People even seem to agree on a handful of specific cultural traits that foster innovation. And yet organizational culture is one of those things that innovation leaders consistently worry about—45% of respondents to a 2018 survey by Innovation Leader and KPMG said cultural issues were their company’s single biggest obstacle to innovation.
If we agree that culture is important, and agree on what elements of culture matter most, why is culture still such an obstacle for so many of us? More importantly, how can we move things in the right direction—how can we help our colleagues lean into shared values and behaviors that drive, rather than stifle, innovation?
There's widespread agreement on some of the cultural traits that foster innovation.
From Google to Harvard to the Lean Startup, people agree on the traits that foster innovation. We tend to agree that innovative companies:
- Foster psychological safety. When people feel psychologically safe, they’re more confident taking risks. They don’t worry about negative repercussions for asking questions or suggesting new ideas—both critical behaviors for innovation.
- Are willing to experiment. Experimentation is central to innovation. Effective innovation teams develop hypotheses and devise experiments to systematically learn and gain clarity on paths forward.
- Have a high tolerance for failure. Innovation requires exploration of the unfamiliar and uncertain. Companies that can’t persist through the attendant false starts, dead ends, and outright failures won’t be successful.
Those sound familiar, right? And it would be difficult to argue that innovation thrives in cultures that disdain new ways of thinking, discourage experimentation, and punish missteps. So what’s stopping us from implementing practices that support these values and habits?
Fear of those cultural traits, unchecked, leads some of us to reject them.
In large organizations, it’s easy to imagine the “dark” side of those traits—to envision one or all taken to the extreme. We might imagine a psychologically safe culture as devoid of productive debate or honest feedback. Constant experimentation devolves into aimless chaos. Tolerance for failure could result in a culture of low expectations or shoddy execution.
In Creative Construction, Gary Pisano talks about a certain amount of tension being necessary in innovative cultures—that you need certain practices to “oppose” the quintessential innovation traits. Psychologically safe but brutally candid. Willingness to experiment but highly disciplined. Tolerance for failure but no tolerance for incompetence.1
High-quality innovation performance measurement is the key to the culture balancing act.
In practice, those “opposing” practices can seem even more daunting to implement than their more familiar counterparts. But a high-quality innovation measurement system has them built in, like so:
Psychologically safe … for constructive debate. Your innovation measurement system should include the processes for selecting and periodically reviewing innovation projects. Too often, companies structure these meetings so project leaders are forced to advocate for and defend their work. Rather than pit the project leader against the review panel, it’s far more effective to foster constructive debate, e.g., about hypotheses, testing methods, results. With a foundation of psychological safety, you can invite necessary debate without worrying about discord.
Willing to experiment … while highly disciplined. High-quality innovation measurement provides the discipline that’s necessary for effective experimentation. The metrics you use should help teams select projects and design experiments based on value to the company, in terms of outcomes and/or learning. Knowing up front the criteria for advancing projects provides both clarity and speed in decision-making.
Tolerant of failure … without tolerating incompetence. High-quality innovation measurement systems can differentiate between failure of an innovation project because the idea was fully tested and found to be an unattractive option (acceptable) and failure due to incompetence (unacceptable). Getting the practices above right—constructive debate about highly disciplined experiments in a safe environment—will significantly mitigate the risk of incompetence. But measuring the effectiveness of experiment execution will also be important. That requires tracking output metrics, including measures of both learning and activity. There can also be a role for assessing the quality of execution through, for example, peer-based feedback.
If you’re trying to build or sustain a more innovative culture, a high-quality, complete measurement system will provide the guardrails and discipline you need.
1 Creative construction: the DNA of sustained innovation, Gary Pisano – Public Affairs, Hachette Book Group – 2019.
Posted on July 24, 2019 by Adrienne Brown